MODA helped the Tenant Harassment Prevention Taskforce focus inspection and enforcement resources where risk is highest.
Table of Contents
Overview
Finding the worst cases of tenant harassment in NYC.
In February 2015, the City of New York created a new Tenant Harassment Prevention Taskforce to protect residents of rent stabilized homes. There are some 1 million rent stabilized units in the city, comprising of almost half of the rental housing stock. With the real estate market booming, city leadership was determined to take action against a small minority of landlords who engaged in predatory and illegal behavior to drive tenants out of their homes.
MODA helped the Taskforce focus inspection and enforcement resources where risk is highest, supporting a data-driven approach to standing up for tenants’ rights.
I. Scoping
What is the analytics question?
State law defines tenant harassment as a pattern of behavior that disturbs the comfort of rent-stabilized residents with intent to force their departure. Examples cited in court have included landlords shutting off heat and hot water during freezing weather, imposing extreme noise and dust from construction, or creating other unsanitary conditions.
NYC has some of the strongest laws protecting renters in the country. However there is a legal loophole allowing units to become deregulated when tenants leave, if the rent surpasses a threshold. This, along with high market rate rents, sets up a situation where there is clear financial incentive for landlords to force tenants out of their rent regulated apartments.
The Task Force – which comprises city and state agencies including the Department of Housing Preservation and Development (HPD), the Department of Buildings (DOB), the Department of Health and Mental Hygiene (DOHMH), and the Department of Housing and Community Renewal (DHCR) – was charged with sending inspection team to apartments to issue violations where needed. In addition the Attorney General’s office followed up with litigation procedures in cases where the teams saw harassment rising to the level of criminality.
The Taskforce visited units based on recommendations from elected officials and community groups. However they also wanted to add on a wider set of units that these sources may have missed. They turned to MODA to help identify buildings with possible tenant harassment based on information available in city data.
Because there was no city data set of tenant harassment, MODA redefined the analytics question from “What conditions are possible indicators of tenant harassment?” to “What conditions are possible indicators of rent regulated unit loss?”
II. Data
What data is required?
Data on rent regulated apartments is not straightforward to obtain. DHCR is the state agency in charge of regulating these units. Unfortunately data could not be aquired directly from DHCR. However, the NYC Department of Finance (DOF) charges a $10 tax on every rent regulated unit. Researcher John Krauss was able to obtain this data from DOF and put them into a well-documented and useful format. Understanding this data was key to running our analysis.
MODA’s partners suggested several phenomena that may correlate with tenant harassment, such as recently sold buildings, a history of tenant complaints, the presence of sudden bursts of construction activity, illegal construction, landlords taking tenants to court, and the size of the gap between regulated rent and potential market rent.
In addition to the rent stabilization count data from DOF, the team used:
- HPD Complaints and Violations
- DOB Complaints and Violations
- 311 Complaints (for all agencies)•DOB Construction Permits
- DOF Property Sales
III. Analysis
What data analysis is applicable?
We set out to test which hypothesized housing conditions preceded loss of rent regulated units. First we came up the hypothesized list of predictors based on our discussion with members of the Taskforce.
| Predictor | Data Used |
|---|---|
| Property Sales | DOF Ownership data – when an owner name is updated |
| Construction | DOB Jobs filing, type alt 1-3, on multiple floors |
| Illegal Construction | 311 Service Requests, DOB Complaints for illegal work |
| Complaints from residents | 311 Service Requests |
The City’s 311 service offers an extensive store of data about problems or requests for city services originating with residents. Because there are more than two thousand different complaint types under 311, we grouped these into categories related to tenant harassment.
| Category | Definition |
|---|---|
| Air Quality – NonConstruction | DEP air quality complaints not directly related to construction |
| Asbestos | DEP/DOHMH asbestos complaints |
| Dust – Construction DEP | Dust from construction (outdoor) routed to DEP |
| Dust – Construction DOHMH | Dust from construction (indoor) routed to DOHMH |
| Construction | Complaint area containing ‘construction’ |
| DOB Illegal Work | DOB complaint containing: illegal, unsafe, safety, or permit |
| DOB | Any other DOB complaint |
| Dirty Conditions | Includes DSNY/DOHMH rodent, mold, unsanitary, standing water, vector, sanitation condition, dirty conditions |
| HPD – No Services | HPD Heat/Hot water, electric, gas, refrigerator |
| HPD | Any other HPD complaint |
| Hazardous Materials | DEP hazardous materials |
| Other | Everything not included in other categories. These are complaints expected to be tangentially related to tenant harassment. |
| NA | Not Applicable Agencies: DOE, TLC, EDC, DCA, DOITT |
All the predictors shared a unique tax lot ID with the DOF rent stabilized data, so we were able to merge these together and then test for which predictors were more likely to be associated with unit loss.
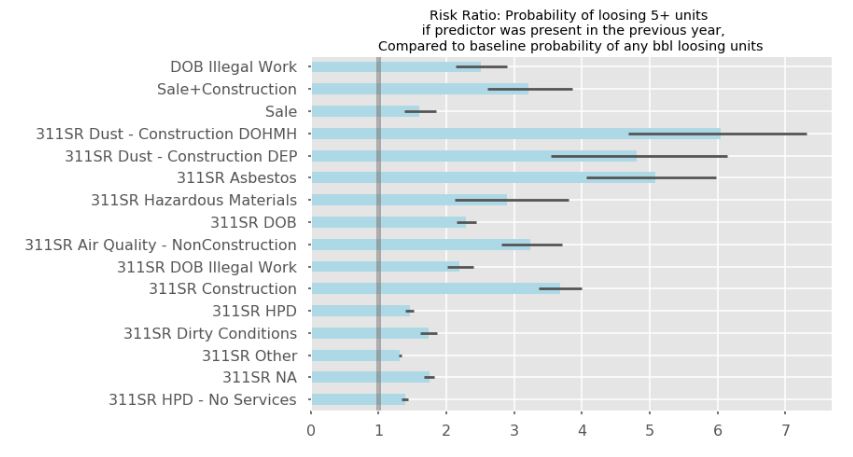
The Risk Ratio is a comparison of the probability of unit loss in buildings where a predictor was present in the previous year, with the baseline probability of unit loss for all buildings across the city. The findings of this analysis showed which predictors were associated with unit loss. MODA used the risk ratio because it is straightforward to explain and understand. More complicated multivariate analysis may be possible (although limited by the amount of data available), but then we loose the straignforward explainability without gaining much in predictability. The team steered away from overengineering the analysis, especially since the ultimate goal is identifying where tenant harasment is happening while the data is on unit loss.
The analysis confirmed the importance of key indicators, such as recent sales followed by construction activity, and brought into focus several additional indicators. Buildings with recent asbestos complaints, for example, were five times more likely to experience rent stabilized unit loss compared with the average rent stabilized building.
The details of our approach and analysis can be found here:
IV. Pilot
How can the analysis improve the operation?
Having identified the predictors associated with unit loss, the team compiled a list of buildings exhibiting one or more of them in the past six months. MODA worked with the the Office of Enforcement and Neighborhood Services at HPD, in charge of selecting addresses for the Task Force. They had previously based most of their inspections on word of mouth recommendations, but also wanted to send the Task Force to other places in that same vicinity. This allowed for more efficient use of the inspectors’ time. They were able to sort the list by neighborhood and send the inspection teams to those addresses.
MODA received anecdotal evidence that the model was sending the Task Force to places that exhibited potential signs of tenant harassment. In the future, a quantitative assessment would be possible based on results of the inspections (e.g. places were visited, types of violations issued, other follow ups).
V. Handoff
Is the model sustainable?
MODA sends an updated list of buildings to the Taskforce every two to three months.
Summary
Prior to this project, the Tenant Harassment Prevention Taskforce selected addresses for inspections and follow-up actions based on recommendations and professional judgment. The model added value by bringing datasets together to model behavior associated with a carefully defined target variable. The list has helped inspectors, when in a specific neighborhood, select additional addresses to visit. While expert judgment has remained central to countering predatory landlords, the analysis has helped identify key factors that correlate strongly with rent stabilized unit loss, bringing high-risk complaints to the front of the queue for enforcement action.