One in every 67 Americans under the age of 18 is a public school student in New York City. MODA partnered with the Department of Education to help its Office of School Support Services deliver free lunch to them all.
Table of Contents
Overview
Providing free universal lunch to all students
The National School Lunch Program, administered by the United States Department of Agriculture, subsidizes free or discounted lunch programs for children from low-income families in participating school districts. The New York City Department of Education is one of those districts. Traditionally, schools were reimbursed based on the number of meals served to eligible students. This caused concern, however, that this led to stigmatization of students based on the level of their family’s income. As a result, advocates and officials have pushed for universal programs that provide free lunch to all students, regardless of income. In 2010, the Community Eligibility Provision (CEP) added to the National School Lunch Program to allow schools to receive an omnibus reimbursement based on the income demographics of their students, rather than a reimbursement for individual number of meals. Participating schools are required to provide breakfast and lunch at no charge to all students. After a pilot in the 2014-2015 school year, New York City announced its full participation in the program in September 2017.
MODA worked with the Office of School Support Services at the DOE to develop a Monte-Carlo method optimization algorithm to maximize the reimbursement it received from the federal government. The project also demonstrates how using open source software, such as Python, turned an intractable problem into one solvable on a single laptop.
I. Scoping
What is the analytics question?
Through a series of conversations with the Office of School Services at DOE, MODA learned that the amount of federal reimbursement for CEP depends on the percentage of identified students who are categorically eligible for free meals. This percentage is based on the number of students participating in other government program such as Supplemental Nutrition Assistance Program (SNAP) and Temporary Assistance for Needy Families (TANF). Schools can be enrolled in the program individually, or in groups. How to group a set of schools has no geographic or other constraints – this decision is entirely up to the school district. The amount of reimbursement changes depending on these groupings. The analytics question was how to find the optimal school groupings to maximize reimbursement.
II. Data
What data is required?
For each school the following data is needed:
- the number of identified students,
- the total number of students,
- the projected number of breakfasts and lunches for the coming year.
The projected number of meals is based on meals served in previous years. Because most of these schools were not part of a universal lunch program prior to this, the meal projections will likely be different from the actual meals served. However because the school groupings need to be submitted before the meals are calculated, an exact number is not possible.
III. Analysis
What data analysis is applicable?
This is a combinatorial optimization problem, similar to some very well-known problems such as the traveling salesman and the knapsack problems. The challenge is finding an optimal solution among a discrete set of objects.
This problem is straightforward to solve for a handful of schools. The reimbursement can be calculated for each possible grouping and the highest grouping would be chosen. But as the number of schools grows this type of exhaustive or brute force approach quickly becomes impossible. With over 1000 schools an exact result is well out of reach, but we were able to find an approximate solution.
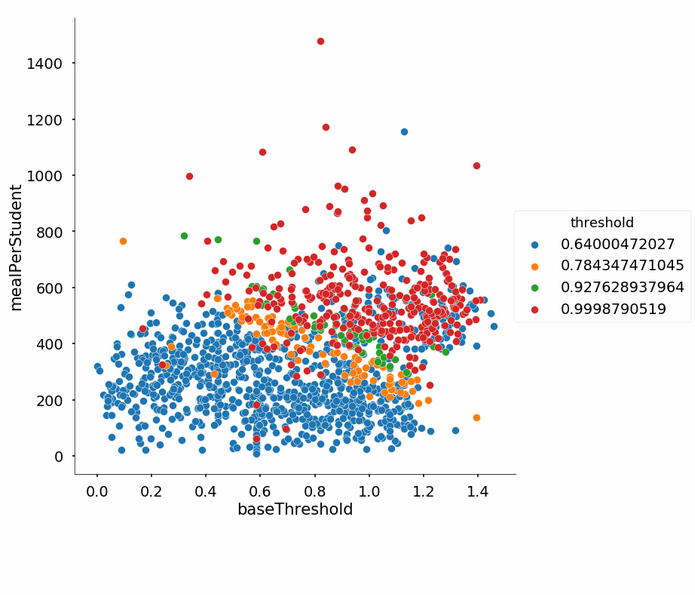
We tried a number of approaches and found Monte Carlo to be the most elegant to implement and also gave the best results. Monte Carlo techniques have traditionally been used as a clever way to simulate complicated probability distributions. In this case, we were only interested in the maximum value (highest reimbursement), so we used two well-known derivations: stochastic hill climbing and simulated annealing.
We implemented these approaches in Python, using Pandas vectorized methods to reduce runtime. In addition we used the multiprocessing package to do runs in parallel and choose the best of the lot.
The details of our approach and analysis can be found here:
IV. Pilot
How can the analysis improve the operation?
We initially intended to run this algorithm on NYC schools new to the CEP program for the 2017-2018 school year. However because of an administrative change in how identified students are counted, a single grouping now yields the highest possible reimbursement.
School districts that could potentially benefit from this approach would have at least 30 schools and a identified student rate of under 62.5%
V. Handoff
Is the model sustainable?
DOE will be able to use this algorithm in subsequent years to calculate the CEP school groups. This will be useful if the percentage of identified students as a whole falls below 62.5%, currently it is very close to that limit and is expected to decrease. After the first year in the program, the school can stay with their previous threshold or be regrouped them for a higher collective reimbursement. The algorithm can be adapted to address this.