The NYC Commission on Human Rights partnered with MODA to assist in identifying sites of potential income discrimination.
Table of Contents
Overview
The New York City Human Rights Law prohibits housing providers from discriminating against potential tenants based on their source of income: whether a potential candidate’s income originated from wages, tips, investments or even public assistance cannot be the basis of why said candidate is denied housing. This protection is designed to assist low income and/or homeless New Yorkers find homes once they have completed the task of securing a housing voucher.
The city agency responsible for enforcing the Human Rights Law is the Commission on Human Rights. According to them, income discrimination is among the top housing-related complaints that they receive each year. The commission has partnered with the Mayor’s Office of Data Analytics (MODA) to assist in identifying sites of potential income discrimination; described here:
The Commission is partnering with the Mayor’s Office for Data Analytics (MODA) to explore how the Commission can use data to enhance its testing program, the Commission said in a statement provided to Civicist. During 2016, this partnership allowed the Commission to better identify source of income discrimination in housing. The data has proven to be very helpful in identifying bad acting landlords in different vulnerable communities and the Commission will continue using data to more effectively root out source of income discrimination in housing. No New Yorker should be turned away from housing because of how they pay their rent.
Some results of this partnership are shared here to serve as an example of the utility and value of combining a robust Open Data platform, data analytics and subject matter expertise in order to inform the delivery of local government services.
I. Scoping
What is the analytics question?
The Commission has “testers” that can pose as potential candidates for housing in order to be sure that landlords or management companies are not discriminating against the protected classes identified in the City’s Human Rights Law.
These testers are very effective at their work, but New York City has more than 1 million buildings within its borders, and CCHR will not be able to test them all. In 2016, CCHR performed “more than 300 tests for source of income housing discrimination citywide” according to this report; at that rate, we could cover the whole city in about 3,000 years if we simply decided to test all buildings. The Commission asked MODA to help choose which locations and entities to test so that ~300 tests are most effective in a universe of over 1 million locations.
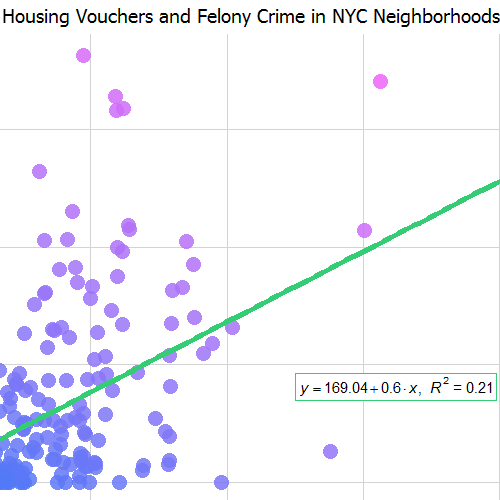
From working with CCHR as well as the Fair Housing Justice Center we were able to understand this problem more deeply. Through many meetings with the project team, a simple yet telling narrative emerged. It is one that states there are many neighborhoods within New York City, and each can be very different. Often in large cities across the US, one neighborhood may boast many positive outcomes including: low crime, high achieving schools and an affordable rental stock, while the next neighborhood may look very different on the scale of these outcomes. For this reason, federal as well as local governments have created housing choice voucher programs. These programs aim to help vulnerable populations of residents (low income, disabled, seniors, etc.) relocate from neighborhoods with historically poor outcomes into neighborhoods with a more positive outlook. One major problem: some landlords and management companies are denying candidates with these vouchers illegally, causing these neighborhoods with preferable outcomes to foster very low numbers of Housing Choice Vouchers, and in the process, prevent vulnerable populations with vouchers from benefitting from stronger neighborhood outcomes. Even if we classify neighborhoods where this is happening, how can we coerce a change in this behavior at large?
Fortunately, NYCCHR had a strategy in mind: make an example of the larger bad actors in the space, with hopes that other, smaller operators partaking in this poor behavior will fall in line. This allowed us to get even more specific with the locations to test first: they must be part of a larger portfolio of properties across the city, leaving the question of ‘how do we form a housing portfolioknowing very little about building owners, and with most buildings publicly reporting that they are owned by an LLC whose name usually closely matches the address of said building (like in the ‘OwnerName’ field in PLUTO)?
II. Data
What data is required?
Through our Scoping phase, we were able to identify the following analytics questions
- How do we define a NYC Neighborhood?
- What are the outcomes we can measure within every NYC neighborhood?
- What data can we use to test the crime/schools/housing stock hypothesis?
- How can we group buildings into ownership portfolios?
- What do we know about each building/tax lot in NYC?
This set of questions form a more bounded project scope than answering ‘where is source of income discrimination happening in NYC?’ and allowed us to start what is sometimes referred to as a ‘fishing expedition’, where we’re looking to find facts in existing datasets. While many datasets were explored, we found the following to be relevant:
- New York City ‘Neighborhood Tabulation Areas’ shapefile from DCP: Well, this answers some part of our first question: it looks like NYC Neighborhoods are defined for us by DCP’s “NTA”, or Neighborhood Tabulation Area. As a lifelong NYC resident – some of these boundaries could probably be hotly contested across the dinner table, but for the most part they fall in line with our idea of the city’s neighborhoods (according to this dataset, there are 195).
- 2014-2015 School Quality Reports from DOE: These reports are released for all public schools in NYC. They aggregate a number of interesting metrics at the school level for Elementary, Middle, and High Schools throughout the city. The one metric that seemed quite relevant here was the ‘Student Achievement Score’, which is understood to be some measure of how well students score on standardized testing. This is how we classify school performance.
- 2015 Major Felony Crimes data from NYPD: Luckily NYC is very transparent with its crime statistics and maintains an all-encompassing list on the Open Data Portal. The locations themselves are already anonymized to a certain extent, having been aggregated to the corner or mid-street where they occurred. Still, this information will be a strong tool in classifying neighborhoods based on the amount of felony crime they experience.
- PLUTO land use data from DCP: Ah, NYC PLUTO data. This dataset comes in either a flat file (PLUTO) or a shapefile (mapPLUTO) format. It is an aggregation of roughly 100 variables describing every physical tax lot in the city of New York. There are metrics detailing the size of each lot, the breakdown of the lot’s use by square footage, overall use of each lot, the zoning of each lot, etc. PLUTO is a strong tool for city administrators to answer any number of questions, but here we will use it to identify the number of rentals / amount of housing stock available in each neighborhood.
- NYC Tax Bills scraped from DOF PDFs by John Krauss: This data was used for an interesting analysis of rent stabilization counts by then NYU-based researcher John Krauss. In his quest to learn more about rent stabilized apartments in NYC, Mr. Krauss collected the tax bills (in PDF format) from most residential NYC tax lots. While he was looking for something different than we are currently, there is one piece of information that we noticed from his work: there is a mailing address for every tax bill. Building owners may be able to successfully hide their names from us through forming an LLC – but where are they having their tax bills mailed? Are NYC lots that share a tax bill mailing address somehow related?
- 2015 Census 5-year American Community Survey data: Largely speaks for itself, the 5 year ACS provides a somewhat recent look at population / demographic / economic breakdowns in each census tract (which we can then sometimes aggregate to the NTA thanks to DCP). This source will help us get a more detailed view of each neighborhood in terms of income, population or other demographics.
- Housing Choice Vouchers by tract from US Dept. of Housing and Urban Development: This was an exciting find, and not a piece of information that was well known within our office, or that of NYCCHR. This is a shapefile, provided by the US federal government. It aggregates the count of all housing choice vouchers (like section 8) to the census tract level, which provides us with a view of where throughout the country (as well as the city) housing choice vouchers are being used. An important thing to remember is that our definition of neighborhoods – “NTAs”, are actually aggregations of specific census tracts done by NYC DCP. This makes going from census tracts –> NTAs quite easy for simple counts. Thanks DCP!